

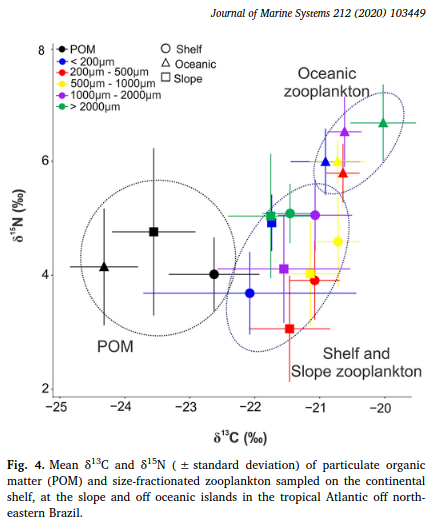
Size-based approaches are paramount tools for the study of marine food webs. Here, we investigated the re-lationship between zooplankton body size, stable isotope composition and trophic level (TL) along a large-scale onshore-offshore gradient in the western tropical Atlantic. Samples were obtained on the Brazilian continental shelf, slope and in oceanic waters (off Fernando de Noronha archipelago and Rocas Atoll) in September and October 2015. Zooplankton was sieved into five size fractions. Zooplankton was dominated by copepods, except for the largest (> 2000 μm) size fraction, that showed a high biovolume of chaetognaths, decapods, and fish larvae. Maximum zooplankton abundance and biovolume was found at the continental slope. POM showed consistently lower δ13C than zooplankton, indicating a selective use of 13C-rich primary food sources by zoo-plankton. Particulate organic matter (POM) was more 13C-enriched in shelf areas (average: −22.8, −23.6 and − 24.3‰ at the shelf, slope and oceanic islands, respectively), probably due to the higher abundance of diatoms nearshore. POM had δ15N values between 2.5 and 6.9‰ (average: 4.0, 4.9 and 4.2‰ at the shelf, slope and oceanic islands, respectively). Zooplankton δ15N and TL increased with body size. The δ15N of the 200–500 μm size fraction was used as baseline for TL estimation. Oceanic areas (average baseline δ15N = 5.8‰ ± 0.52, n = 14) showed a higher baseline δ15N than the shelf (average = 3.9‰ ± 0.69, n = 9) and the slope areas (average = 3.1‰ ± 0.93, n = 9). In spite of differing baselines, the δ15N data produced a consistent pattern of log-linear increase in TL with increasing size, in all areas. The choice of input trophic enrichment factor (TEF) values only slightly changed the log10 (body size) vs TL slopes, but this choice had a considerable effect on the estimates of predator/prey size ratio (PPSR) and predator/prey mass ratio (PPMR). Using a TEF above 2.3 leads to unrealistic PPSR and PPMR estimates. Overall average slope was 0.59 ± 0.08 TL μm−1 with TEF = 2.3 and 0.42 ± 0.07 TL μm−1 with TEF = 3.2.
https://doi.org/10.1007/s00382-020-05424-x