

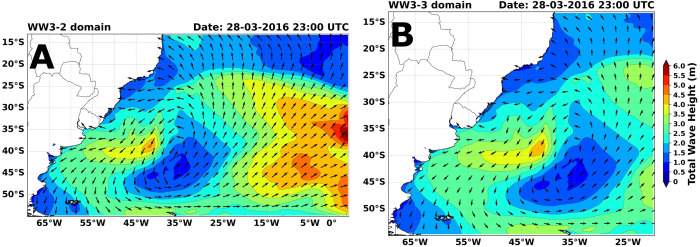
In March 2016, the passage of a cold front on the southern coast of Brazil generated extreme meteo-oceanographic conditions along the southern Brazilian coast. This work investigates the wave field evolution during this period from in situ observations and numerical modeling. The observations were obtained from high-frequency measurements performed in four sites along the coastline (Santos, Tramandaí, Rio Grande, and Cassino). The wavefield simulations were performed by coupling the Global Forecast System (GFS) reanalysis and the WAVEWATCH-III (WW3) ocean wave model. In a synoptic analysis was observed that not only the cold front caused the high wave in the area, but the interaction between the front post-high-pressure center and a low-pressure center generated a substantial pressure gradient area along the Brazilian coast with winds between 17.1 and 20.7 m s−1 reaching up to 24.4 m s−1. Model estimates confirm the presence of high waves between 6.0 and 6.5 m on the Southern coast of Brazil. Also, in the adjacent deep waters of the South Atlantic Ocean, highly simulated waves reached significant wave heights of 9 m. An analysis of the model input wind indicates that the GFS winds represented very well the trends and evolution of the wind registered by ocean buoys, with a small phase error. The t-test shows no significant differences in any buoys, with p-value = 0.73 and p-value = 0.78, with a significance level of 0.05.
The best WW3 domain identified to simulate the wavefield off the coast of Southern do Brazil was 70°W – 4°W longitude and 55°S – 13°S latitude. Two buoys and two ondographic records in the area were used to evaluate the simulations in shallow water. In contrast, a reanalysis with satellite data assimilation was used to compare the simulations. In shallow water, the results for significant height of Wind and Swell Waves (SWH) show how the WW3 model slightly advances the maximum SWH time in relation to the buoys and ondographs records. This maximum SWH simulated by WW3 is in correspondence with the maximum GFS and records wind. The WW3 model underestimated the maximum SWH compared to the maximum buoys recorded and overestimated the maximum SWH compared to the maximum ondographs recorded. The Peak Period (Tp) simulations also showed an underestimate by the model in the two buoys and two ondograph locations. The BIAS distribution showed low values of the SWH in deep water between -1.2 m and 1.2 m. In general, in each analysis carried out, the t-test showed that there are no significant differences between the SWH and Tp simulated and the SWH and Tp records.
In the analysis of the directions, it was observed that the strongest winds were recorded from the E direction for both Rio Grande (above 18 m s−1) and Santos (12-15 m s−1) buoys with frequency values of 27.8% and 12% respectively. As a reflection of the wind, predominant directions of E-SE waves were observed with high-frequency values in the Rio Grande (43.1%), Santos (54.2%), Cassino (67.4%), and Tramandaí (100%) records. The presence of waves with Tp (less than 12s) was observed in the records of buoys and wave gauges related to wind-wave. Only in the Santos buoy were observed waves with Tp higher than 12s (swell). The model showed a difference of 22.5° between the recorded wind and wave roses, and 45° between the recorded wind roses and the wave rose.
DOI: doi.org/10.1016/j.rsma.2023.103071
Reference
Borges, D. M., Varona, H. L., Alonso, M. F., Araujo, M., & Hernandez, F. (2023). Investigating an extreme meteo-oceanographic event in the southern Brazil from in situ observations and modeling results. Regional Studies in Marine Science, 65, 103071.